Article template — every element on one page
A template, not an article. Every piece of formatting a post can use appears here once: headings, lists, a pull quote, a table, code, an image, a captioned figure and footnotes.

This is the English template. Copy the directory src/content/blog/article-template/, give the
copy its own slug, and replace everything below. Its Dutch counterpart is artikelsjabloon/;
the two share a translationKey, which is why a link to the other language appears at the foot
of this page.
Frontmatter
Every field the schema knows about is below. Only title, description, pubDate and lang
are required; the rest have defaults or can be left out. A missing lang fails the build,
deliberately.
title: "The title of the article"
description: "One or two sentences. This is the deck on the card, the meta description and
  the summary in the RSS feed."
pubDate: 2026-08-10          # required, and orders every index
updatedDate: 2026-08-13      # only for a substantive revision
heroImage: ./hero.png        # colocated, in the post's own directory
lang: en                     # 'nl' or 'en', no default
tags: ["heat-pump"]          # lowercase, hyphenated, no language prefix
translationKey: article-template   # the same key as the translation
draft: false                 # true keeps the post out of every index, feed and build
Reading time is not in the frontmatter and must never gain a field there: it is counted from the post’s own text at build time and shown in the line beneath the title.
A second-level heading
Running text with a link, some bold and italic, a piece of inline code, and
a figure of 168,014 to show how numbers are set. A long compound like
heat-pump-subsidy-scheme has to break on a 360-pixel phone rather than stretch the line.1
A third-level heading
A second paragraph, so the space between a heading and its text is visible.
A fourth-level heading
The deepest heading the typography defines. If you find yourself below it, the article is probably two articles.
Lists
- The first item of an unordered list
- A second item, long enough to run onto two lines and show the indentation
- A nested item, which sits closer to its parent than to its neighbour
- A third item
- The first numbered step
- The second numbered step
- The third numbered step
Pull quote
A quotation of two lines, without quotation marks, where the rule and the shift in colour together mean “set apart”.
Table
A table is wider than a phone, so it scrolls inside its own frame.
| Year | Sold | Growth |
|---|---|---|
| 2024 | 158,538 | 12% |
| 2025 | 136,000 | −14% |
| 2026 | 168,014 | 6% |
Code
const growth = (now, then) => (now - then) / then;
console.log(growth(168014, 158538));
Images
Two forms, and the difference is not cosmetic. A plain image is written with markdown syntax,
which runs it through Astro’s image pipeline: webp, srcset, lazy loading and explicit
dimensions.
If you want a caption it has to be <Figure>, because markdown cannot produce a
<figcaption>. The two import lines are at the top of this file. The caption is a slot, so
it can carry a link to the source.

FIG 1 · Renewable capacity additions worldwide, 2019–2026. SOURCE: IEA, 2026.
Never hand-write an <img> tag in MDX: it bypasses the pipeline and ships the original file
with no dimensions and no lazy loading.
Charts
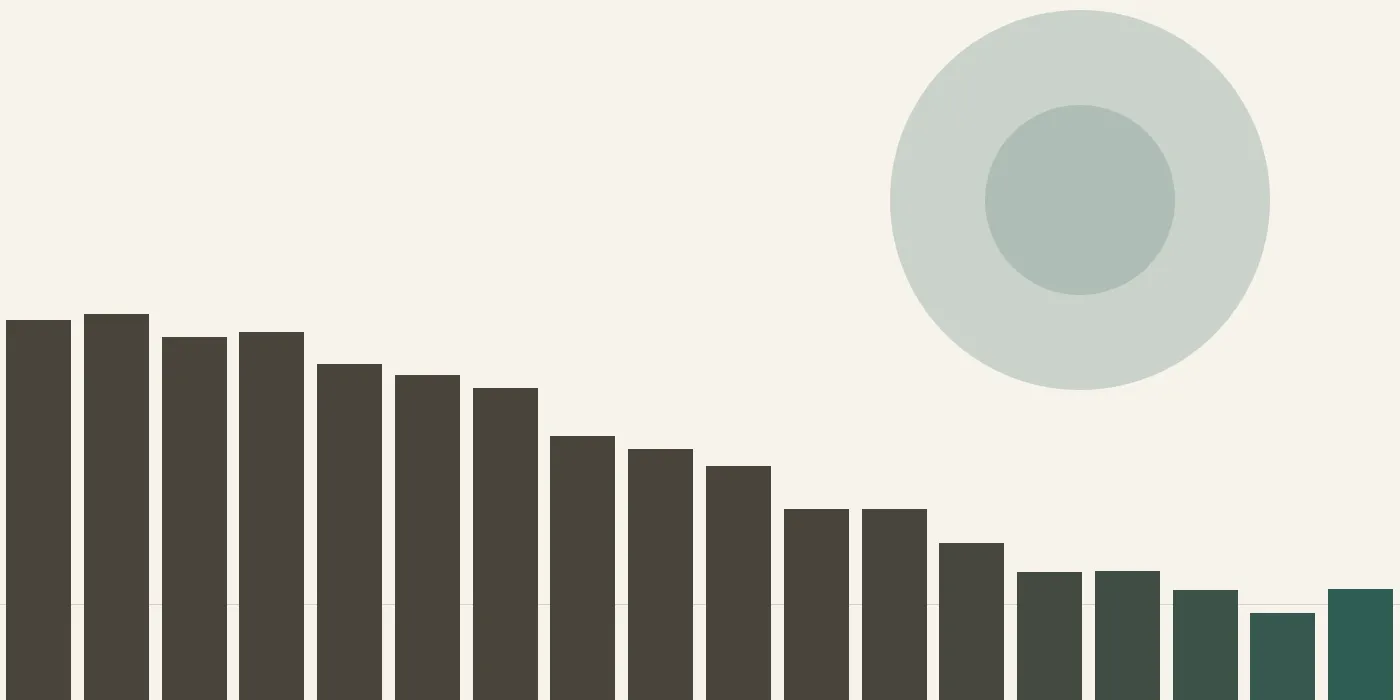
A chart is an Astro component: imported at the top of this file like <Figure>, and placed
where it belongs in the argument. Its numbers live in data/ beside this post, its caption is
written here, and the source line beneath it comes from the data file itself so it cannot drift
away from the figures it describes.
FIG 2 · Renewable capacity added per year, 2021–2026.
SOURCE: illustrative figures, not real data — see data/capacity-additions.json.
Show the figures
| Year | Renewable capacity added per year (GW) |
|---|---|
| 2021 | 28 |
| 2022 | 34 |
| 2023 | 41 |
| 2024 | 39 |
| 2025 | 52 |
| 2026 | 61 |
Tap or click a year to pin its value; tap anywhere else, or press Escape, to let it go. The same numbers are under Show the figures, which every chart carries — nothing on this site is reachable only by pointing at it. The picture is finished SVG before any script runs, so it is all there with JavaScript switched off, and it is drawn once for both themes.
After a horizontal rule, one closing paragraph, with the footnotes beneath it.